Compare your portfolio to a benchmark
The Benchmark page compares your return against a market benchmark, so you can see whether you’re actually beating the market. By the end of this, you’ll know how to read the comparison.
Open the page
Section titled “Open the page”- Select a portfolio or group from the sidebar selector.
- Go to Performance → Benchmark. It works in group mode too.
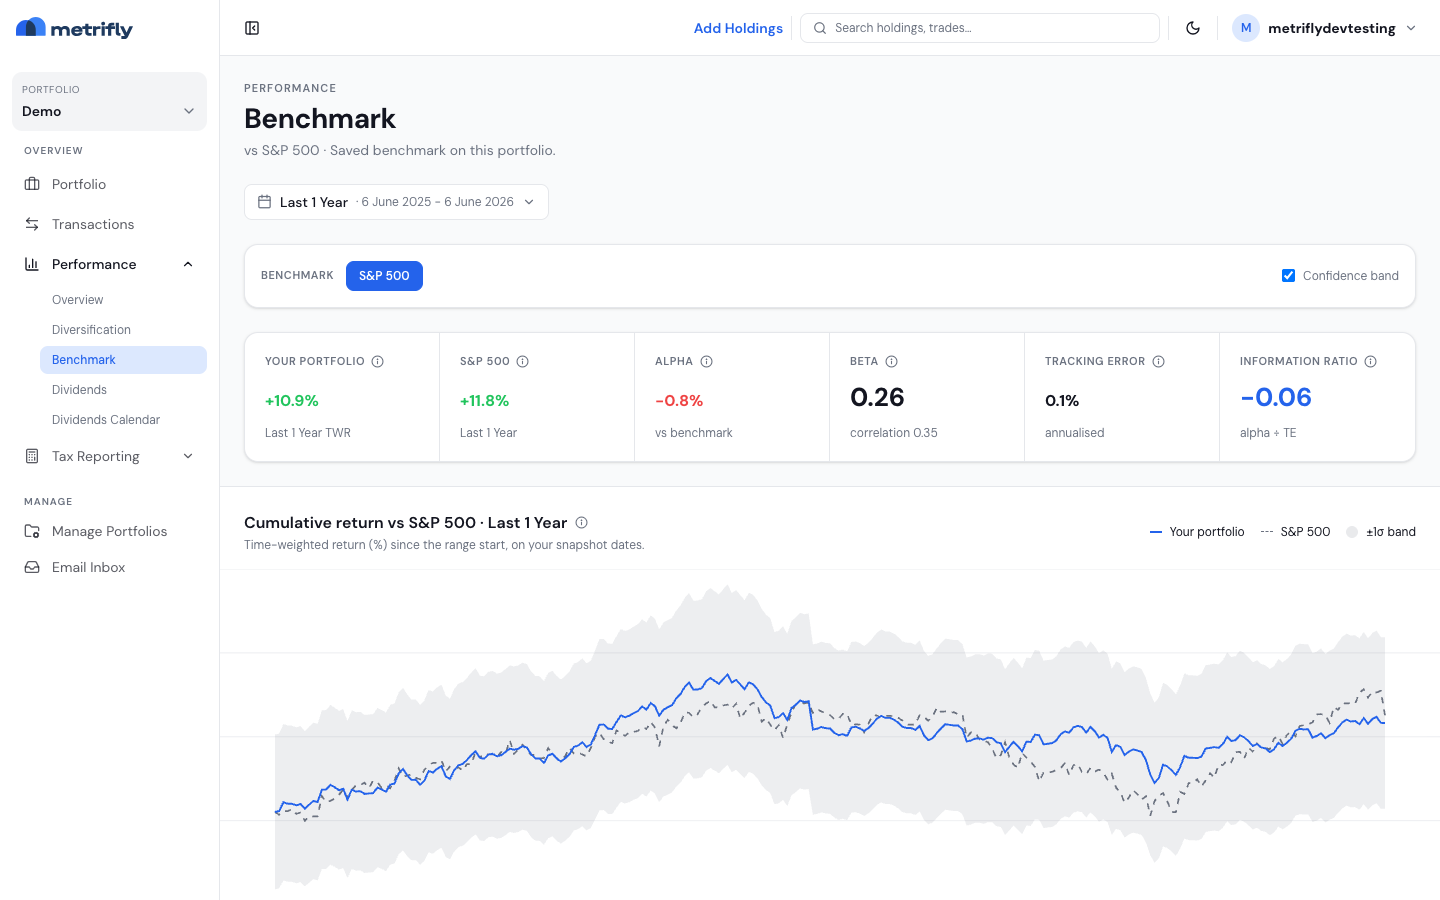
The page opens on Last 1 Year. Use the date range bar and ‹ › steppers to change the period.
Choose a benchmark
Section titled “Choose a benchmark”The Benchmark selector lists the benchmarks configured for your portfolio. Click one to compare against it. If you haven’t set any, Metrifly compares against the SPDR S&P 500 ETF (SPY) by default — a total-return proxy that includes dividends.
Read the stat strip
Section titled “Read the stat strip”Three cells summarise the selected range:
| Cell | What it shows |
|---|---|
| Your portfolio | Your return for the range (capital + income + currency), using the same analytics as the Portfolio page for the selected position scope. Shown p.a. when the range is at least one year; otherwise as a period return. |
| Benchmark | The benchmark’s return in your portfolio’s currency — price change, dividends, and currency effect added together (same rules as above). |
| Difference | Your return minus the benchmark’s. Positive means you beat it over the period. |
Return breakdown
Section titled “Return breakdown”The Return breakdown table shows total return, capital gains, income return, and currency gain/loss for both your portfolio and the benchmark — as percentages and dollar amounts. The Difference column is the alpha for each component.
Benchmark dollar amounts are scaled to your starting portfolio value so you can compare side by side in your portfolio currency.
Read the charts
Section titled “Read the charts”- Return breakdown cards — click a component (total return, capital gains, income, currency) to chart it against the benchmark.
- Comparison chart — your portfolio (solid) vs the benchmark (solid with shaded area), rebased to 0% at period start. Use the dropdown or the cards above to switch the metric. The footer shows period percentages, the difference, and your dollar impact for that component.
Contribution to alpha
Section titled “Contribution to alpha”The Contribution to alpha · per holding table breaks your out- or under-performance down by holding — its weight, the holding’s return, the benchmark’s return for the range, the difference, and each holding’s contribution to the total. A large position that slightly beat the benchmark can matter more than a small one that beat it heavily.
Troubleshooting
Section titled “Troubleshooting”| Problem | Fix |
|---|---|
| You see a “Custom Benchmarking” upgrade card | This needs a paid plan. See Compare plans and pricing. |
| Only SPY appears | No benchmarks are set. Add them under Set benchmarks for a portfolio. |
| ”Couldn’t load benchmark comparison” | Use Retry; if it persists, check for a failed import. |
| Cards say “No data” | The range is too short or lacks price history. Widen it. |
| The difference is negative despite gains | It’s relative to the benchmark — you can gain yet still trail the market. |