See how your portfolio is performing
The Overview page is your headline summary: the two main ways of measuring return, side by side, plus risk measures and your best and worst holdings. By the end of this, you’ll know what each figure means and which one to use.
Open the Overview
Section titled “Open the Overview”- Select your portfolio from the sidebar selector.
- Go to Performance → Overview.
It opens on Last 1 Year by default. Use the date range bar to change the period, the ‹ › steppers to move one period at a time, or the Filter control to narrow by currency.
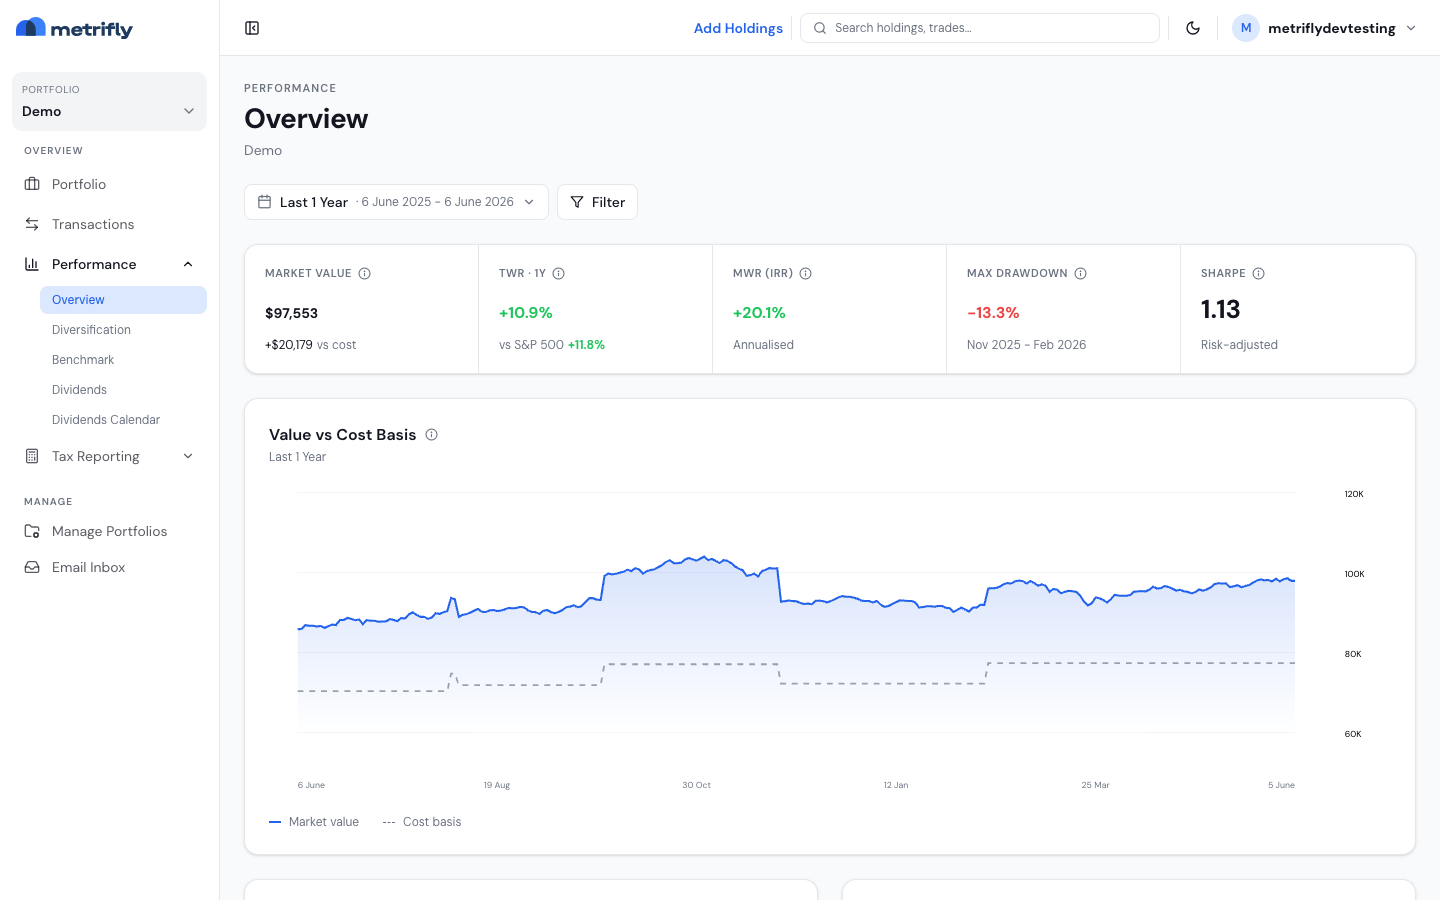
Read the stat strip
Section titled “Read the stat strip”The five cells summarise the selected range:
| Cell | What it shows |
|---|---|
| Market Value | The current value of every holding; the sub-figure is your unrealised gain or loss against cost basis |
| TWR | Time-weighted return — the performance of your investment decisions, ignoring deposits and withdrawals |
| MWR | Money-weighted return (annualised) — your personal return, accounting for the timing and size of your contributions |
| Max Drawdown | The largest peak-to-trough decline over the period, with the peak and trough months below |
| Sharpe | A risk-adjusted return score (above 1.0 is solid, above 2.0 is exceptional) |
Hover the info icon on any cell for an in-app explanation.
Which return should you use?
Section titled “Which return should you use?”Both measure return, but they answer different questions:
- Time-weighted return (TWR) strips out the effect of money going in and out. It measures your investment decisions — use it when comparing yourself to a benchmark.
- Money-weighted return (MWR) factors in when and how much you contributed (computed with the Modified Dietz method). It’s the actual return on the cash you put in.
For the full breakdown of how returns are built, see How your return is calculated.
Read the Value vs Cost Basis chart
Section titled “Read the Value vs Cost Basis chart”This chart plots two lines across the range:
- A solid line — your portfolio’s market value over time.
- A dashed line — the cumulative amount you’ve actually invested (your cost basis).
The gap between them is your unrealised return. A widening gap above the cost line means your investments are growing faster than the money you’ve put in.
Read the top and bottom performers
Section titled “Read the top and bottom performers”Two lists rank your holdings by total return over the range (price movement + dividends + currency):
- Top performers — your five strongest positions.
- Bottom performers — your five weakest. These can be worth a look as tax-loss harvesting candidates or conviction re-checks.
Troubleshooting
Section titled “Troubleshooting”| Problem | Fix |
|---|---|
| ”No portfolio selected” | Select a portfolio from the sidebar, or create one if you have none. |
| The performers lists say “No data for the selected range” | The range has no price history yet. Widen it, or wait for prices to load after an import. |
| TWR has no benchmark comparison | No benchmark is set for the portfolio. Add one under Set benchmarks for a portfolio. |
| The numbers differ from your portfolio dashboard | The dashboard shows dollar returns by source; the Overview shows TWR and MWR percentages. They measure different things. |
| The numbers differ from your broker app | This is usually expected — see Why your return is different from your broker app. |