Check your allocation and diversification
The Diversification page shows where your money actually sits today, grouped however you like — by sector, region, currency, and more. By the end of this, you’ll be able to spot your biggest concentrations and see exactly which holdings drive them.
Open the page
Section titled “Open the page”Go to Performance → Diversification. It works for a single portfolio or a portfolio group.
(If you’ve used Metrifly before, this is where the old Allocation page now lives — /performance/allocation brings you here.)
Group your holdings
Section titled “Group your holdings”Use the Group by control to change the breakdown:
| Option | Groups by |
|---|---|
| Sector | Industry sector |
| Region / Country | Listing geography |
| Currency | Security currency |
| Holding Type | Equity, ETF, crypto, and so on |
| Asset Class | Broad asset class |
| Broker / Source | The broker on the holding |
| Exchange | ASX, NYSE, and so on |
There’s no date-range filter here — the figures reflect your current holdings and market values.
Read the summary strip
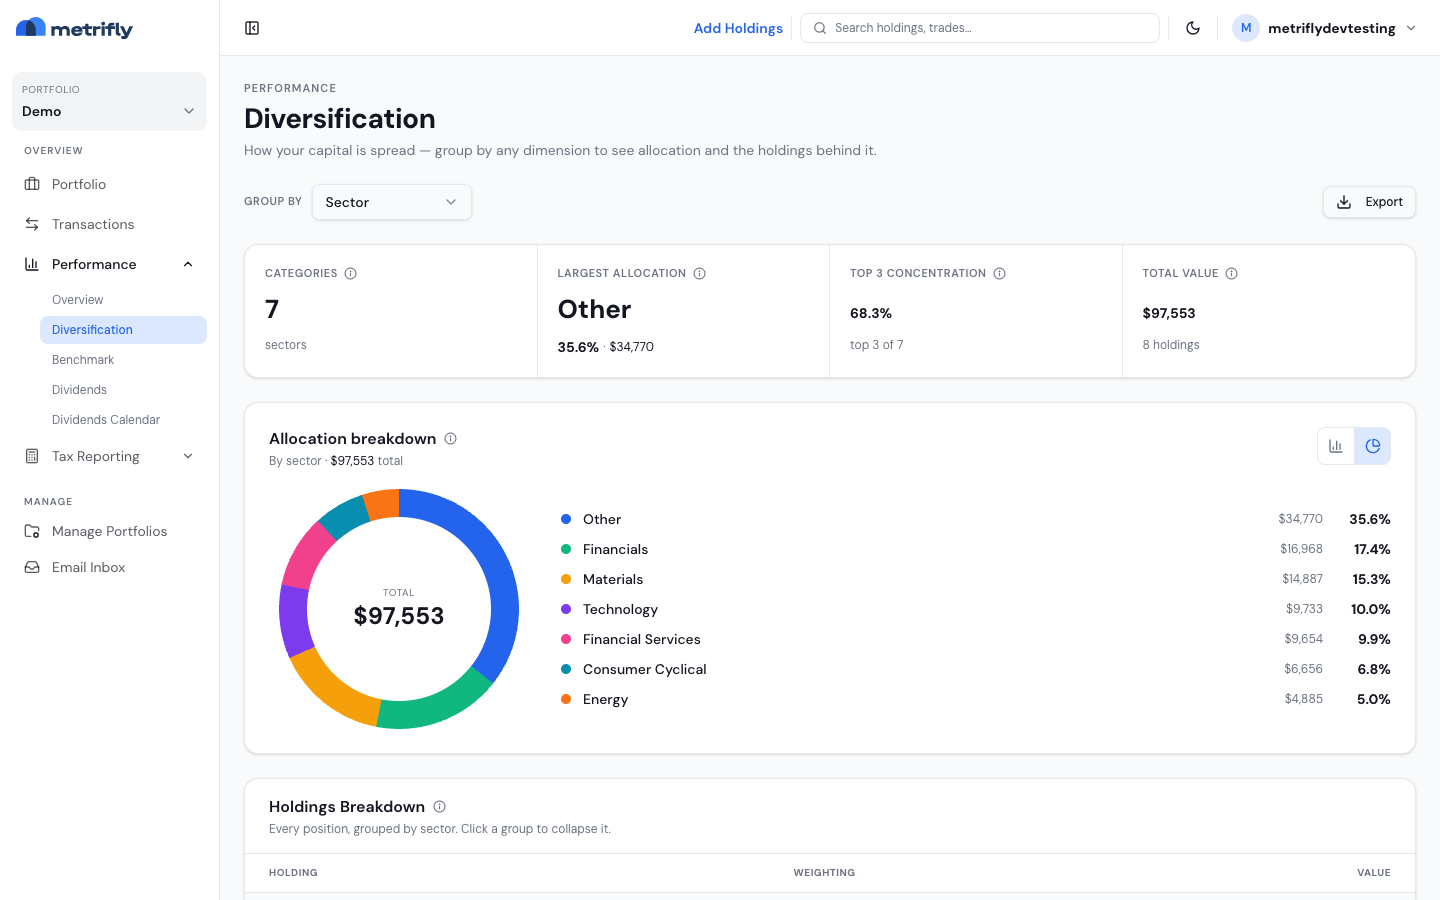
Section titled “Read the summary strip”Four cells summarise the active grouping:
- Categories — how many distinct groups you hold
- Largest allocation — your biggest category by weight
- Top 3 concentration — the combined weight of your three largest categories
- Total value — your portfolio value and holding count
Read the allocation breakdown
Section titled “Read the allocation breakdown”A card plots the selected groups as a donut or horizontal bar chart (toggle in the card header), with a list beside it showing each group’s value and percentage. The Holdings breakdown table below lists the positions under each category, so you can see which tickers drive a concentration.
Export it
Section titled “Export it”Export downloads an Excel workbook of the current breakdown (single portfolio only).
Troubleshooting
Section titled “Troubleshooting”| Problem | Fix |
|---|---|
| You see an upgrade card | This is a paid feature. See Compare plans and pricing. |
| The page is empty | Add holdings via Add Holdings. |
| ”Could not load holdings” | Use Retry, and check the import status on your portfolio dashboard. |
| Sector or region labels are sparse | Security details may still be loading after an import — give it a little time. |