Read your portfolio dashboard
The Portfolio page is your home screen for a single portfolio. It shows your value over time, breaks your return down by where it came from, and lists every holding below. By the end of this, you’ll know how to read each part and how to change what you’re looking at.
Open the dashboard
Section titled “Open the dashboard”Select a portfolio from the sidebar selector. The dashboard opens automatically as the Portfolio view.
Choose a date range
Section titled “Choose a date range”The date range bar at the top sets the period for everything on the page. Click it to pick from grouped presets:
- Days — Today; Yesterday – Today; Last 7 Days; Last 30 Days
- Months — This Month; Last Month
- Calendar Years — This Calendar Year; Last Calendar Year; Last 1 / 2 / 3 Years
- Financial Years — This Financial Year; Last Financial Year
- All Time
Choose Custom Range… for exact dates, or use the ‹ › steppers to shift the window one period at a time. The dashboard opens on Last 30 Days and remembers your last choice.
Use the Filter control to narrow the view by currency (AUD or USD) or asset class (ETFs, Equities, or Cash).
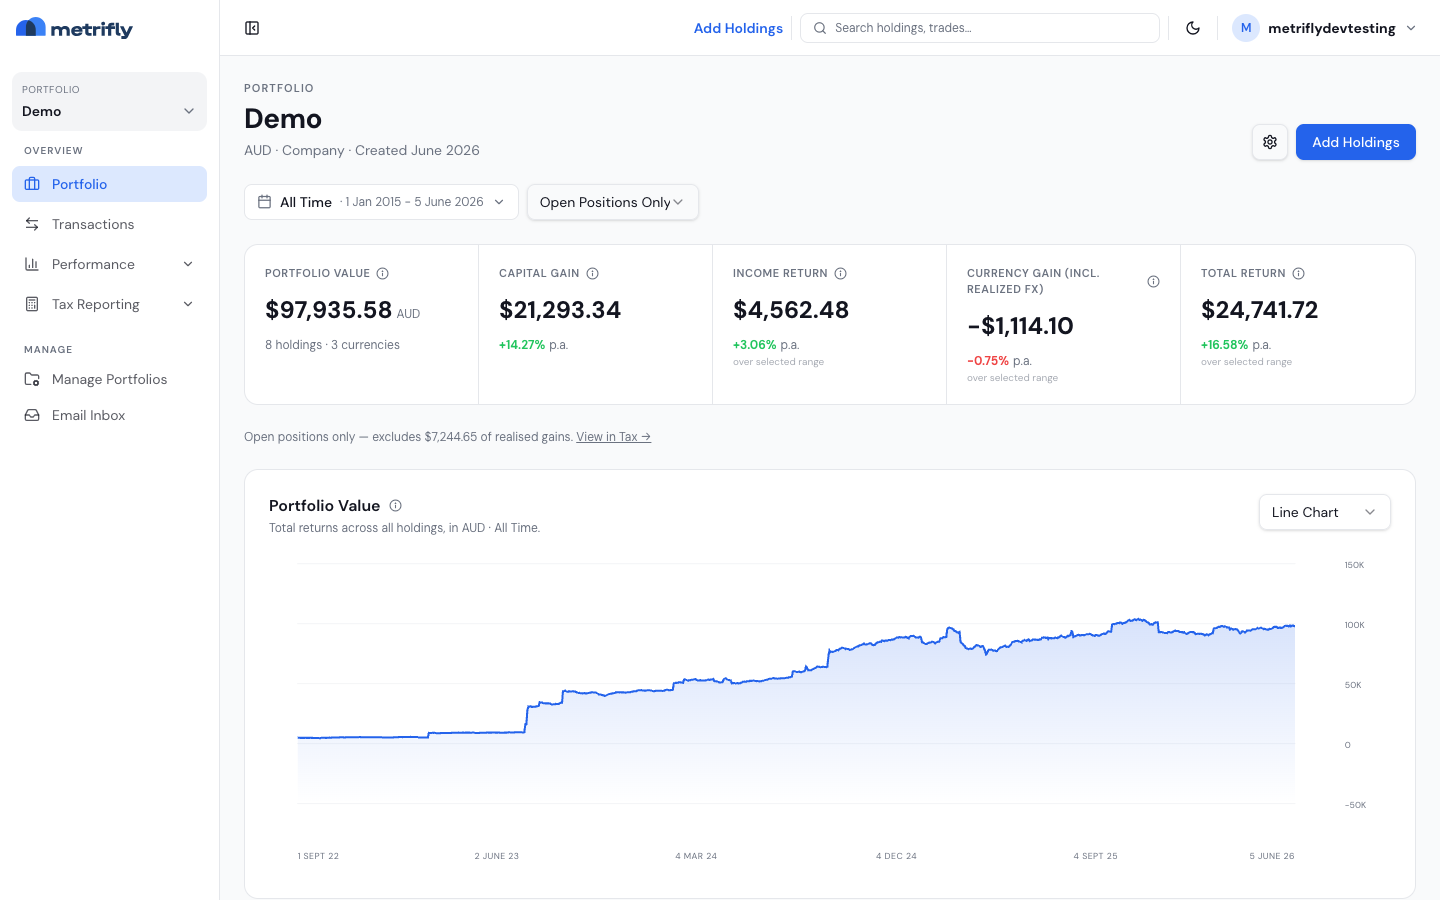
Read the summary strip
Section titled “Read the summary strip”The five-cell strip breaks your return down by source over the selected range. Each cell shows a dollar figure with an annualised % p.a. below it.
| Cell | What it shows |
|---|---|
| Portfolio Value | The current market value of all holdings, converted to your portfolio currency |
| Capital gain | Gain from price movement only over the range |
| Income return | Cash dividends and distributions received in the range |
| Currency Gain | Gain or loss from currency translation of foreign holdings |
| Total Return | Capital gain + income return + currency gain |
Hover the info icon on any cell for an in-app explanation. To understand how these add up, see How your return is calculated.
Read the value chart
Section titled “Read the value chart”Below the strip, the Portfolio Value chart plots your total value across the range. Use the chart-type selector in the top-right to switch between a line chart, a heatmap (value coloured month by month), and a bar chart.
Read the holdings table
Section titled “Read the holdings table”Below the chart, the holdings table lists every position with its quantity, value, and return. Click any row to open that holding’s detail page.
Header actions
Section titled “Header actions”- Settings (gear) — opens the portfolio settings sheet.
- Add Holdings — quick entry for Stocks, Crypto, or Dividends (needs write access).
Troubleshooting
Section titled “Troubleshooting”| Problem | Fix |
|---|---|
| The chart says “No data for this range” | The range predates your first trade, or prices haven’t loaded yet. Widen the range or wait for processing to finish. |
| ”Couldn’t load performance” | Use the Retry link. If it persists, check for a failed-import banner. |
| The values look stale | End-of-day values refresh after the day’s prices load; recently imported portfolios catch up over a short period. |
| Currency Gain is large and unexpected | That’s exchange-rate movement on foreign holdings, not price changes. See the info tooltip on that cell. |